|


| |

Tools for Network Analysis
|
 |
|
|
|
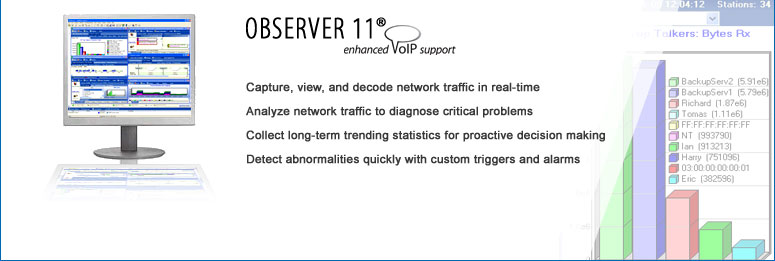
Observer is a network analyzer for
LAN, wireless 802.11 a/b/g, low-utilization gigabit, Token Ring
and FDDI networks. Observer provides real-time metrics, packet
capture, decode, trending and more for shared and switched
environments.
|
|

Compare
Observer Levels
|
|
|


|
Observer is a software-only,
network monitoring and troubleshooting tool. Observer is a
64-bit application. A 32-bit version is also included. Observer
can monitor wired LANs and 802.11 a/b/g networks. With the
addition of Network Instruments?software or hardware probes,
Observer can monitor multi-segment networks including LAN, WAN,
gigabit and wireless.
With the Network Instruments?
Distributed Network Analysis architecture, (NI-DNA),
Observer is unique in the network analysis industry. It뭩 the
only analyzer built from a unified code set, offering
scalability and seamless integration across the entire Observer
product family. Network administrators need ony to learn one
interface to monitor across topologies, locations, and
technologies. To learn more about NI-DNA, click
here.
Observer Benefits:
 | Convert your PC or laptop into a
powerful analyzer
 | Capture, view, and decode traffic in
real time
 | Instantly assess the effectiveness of
network changes
 | Monitor and graph real-time bandwidth
utilization
 | Save historical data
 | Baseline your network
 | Identify virus and hack attacks
 | Collect statistics by user, packet
size, or protocol
 | Filter easily through data to isolate
issues
 | Perform stress testing
 | Speed troubleshooting with proactive
notification
 | View router traffic patterns in real
time
 | Analyze your VLANs independently or
in aggregate
 | Monitor wired and wireless together |
| | | | | | | | | | | | |
| |
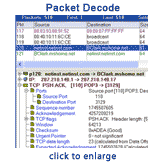
Packet
Capture and Decode |
 | Over 550 primary protocols (decode
listing)
 | Countless subprotocols (including
wireless)
 | Nanosecond resolution
 | Add administrator comments to any
packet
 | Dynamic port protocol decode
 | Schedule packet captures
 | Conceal private IP addresses |
| | | | | |
 | Over 30 real-time statistics
available
 | Network summary
 | Bandwidth utilization
 | Internet Observer
 | Access point load monitor
 | Pair statistics
 | Protocol distribution
 | Network activity
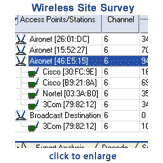
 | Wireless site survey
 | Router Observer
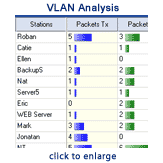
 | VLAN Analysis |
| | | | | | | | | |
 | Understand bandwidth usage by device
 | Determine if a station is consuming
too much bandwidth
 | View LAN use patterns
 | Detect faulty network hardware
 | Make informed decisions about network
segmentation
 | Find broadcast storms
 | Review switch usage and resource
allocation |
| | | | | |
Top Talkers is
the first screen I check every morning. It's a
good snapshot to help me see if the network is healthy
or if something is out of the ordinary. I can
watch protocols, see what traffic is work-related - sometimes its an easy problem like a bad NIC sending out
too much chatter. With Observer I can see all this
activity and proactively manage my bandwidth levels.
Mark Giorgis, Long Beach Transit
Read
Case Study
|
 | Include or exclude packets by
address, address range, protocol offsets, and presets
 | Use Boolean logic to create complex
features
 | Filter with Perl-compatible regular
expressions 
 | Design filters visually
 | Create protocol filters from the
protocol distribution list
 | Execute multiple filters concurrently
 | Share filter libraries with other
Observer users
 | Quickly configure filters with fast
post filtering
 | Utilize data mining capabilities |
| | | | | | | |
 | Flag activities or errors with a
pre-defined list
 | Set custom notifications based on any
filter
 | Receive alerts as vulnerabilities are
detected
 | Choose alert method (e-mail, pager,
etc.)
 | Obtain e-mails with virus information
including source and destination
 | Setup any trigger to have an
associated action
 | Pop up message windows
 | Activate captures
 | Start/append logs
 | Print trouble tickets
 | Execute external programs |
| | | |
 | Manage triggers and alarms for
multiple probes from one location
 | Set a trigger on any WLAN activity |
| | | | | | |
 | View each VLAN data independently or
in aggregate
 | Real-time statistics
 | Determine loads by station and by
VLAN |
| |
| |
Network
Trending and Reporting |
 | Collect trending data for
 | Ethernet
 | Internet
 | VLANs 
 | WLANs  |
| | |
 | Gain insight into total network
health over time
 | Collect and store network, Internet,
and switch data for days, weeks, months, even years
 | View a single time period (i.e. day
or month) or create period-to-period comparison reports
 | Choose text-based, graphical or
Web-based reports
 | Obtain instant snapshots with
Ready-Made Reports
 | Design custom reports and save
templates for later use
 | Auto-generate reports to any folder
or e-mail box
 | Share reports with non-Observer users |
| | | | | | | |
 | Complete support for 802.11a/b/g - no additional software necessary
 | Gain WLAN-specific metrics such as
 | Access Point statistics
 | Wireless types by station
 | Errors by station |
| |
 | Utilize site configuration tools for
better planning
 | Choose from multiple security
encryption options
 | Collect long-term trending
information
 | Stay on top of your WLAN with
Wireless Site Survey
 | Find rogue access points
 | Understand signal quality and data
rates
 | Enforce WLAN security policies
 | Determine AP placement by measuring
signal strength
 | Monitor wired and wireless with one
interface
 | Receive instant notifications on
problems with wireless Triggers and Alarms |
| | | | | | | | | | |
With
Observer's many WLAN features, I can monitor
utilization, watch for rogue access points, run usage
reports, and perform baselining activities뾦mproving
the performance of our wireless network.
Christian Wilson, Select Comfort
Read
Case Study
|
 | Obtain specific Internet activity
 | Review individual Internet usage with
Internet Patrol
 | Receive true Layer 3 IP addresses
with IP Pairs Matrix
 | Use IP Subprotocols by Station to
gain each users' specific Internet usage by service |
| | |
 | Understand router activity
 | Determine router usage
 | Obtain a 밾eads-up?immediate
display of packets/sec, bit/sec, and interface utilization
 | Review traffic by direction (in, out,
total) and percentages of interface utilization
 | One-minute and one-hour displays
available |
| | | |
 | Unique method of easily
cross-referencing data |
|
|
For Sales enquiry, please send email to sales@sstl.com.hk,
or call us at +852 2152 8966.
|
 |
|
| |
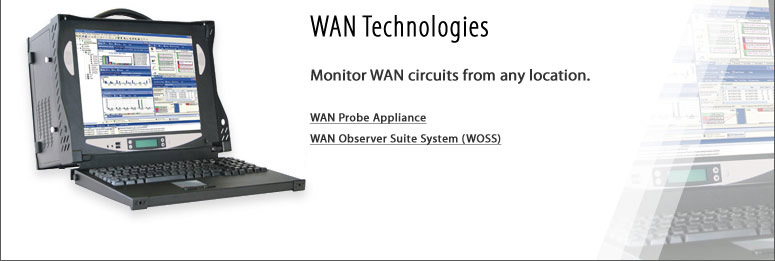
Why cannot users connect to the Internet
or to the remote site through a WAN link? Why is the link so
slow? Is more bandwidth necessary, or is the ISP not fulfilling
its end of the Service Level Agreement? To answer these
questions and more, invest in a comprehensive Network
Instruments Observer WAN solution.
|
|

|
|
|
For Sales enquiry, please send email to sales@sstl.com.hk,
or call us at +852 2152 8966.
| |
Do users complain about slow server
connections? Are you worried that a growing user base threatens
to swamp your gigabit infrastructure? How much of that expensive
hardware is actually being utilized? To answer these questions
and more, invest in a comprehensive Network Instruments Observer
gigabit solution.
|
|
Download
 Observer
Demo Observer
Demo
 Gigabit
Product Family(PDF) Gigabit
Product Family(PDF)
 GigaStor
Brochure (PDF) GigaStor
Brochure (PDF)
|
|
|
For Sales enquiry, please send email to sales@sstl.com.hk,
or call us at +852 2152 8966.

|